Gannets in three-dimensions
By Jude Lane on Monday, September 7th, 2015
So in my first blog I talked about how we use GPS devices to record fixes of a gannets’ location in order to create maps of where it’s been. Using the locations and the time at which they were taken we can calculate metrics such as the distance and duration of a foraging trip. A more detailed look can reveal different behaviours such as searching for food, resting and commuting to and from search areas. When combined with data sets telling us things about the environment such as wind direction, chlorophyll levels (indication of food availability) and fishing vessel tracks, we can learn more about how their behaviour is influenced by their environment.
So we’re getting pretty good at the location tracking stuff (although there’s still so much more to learn) but one of the big gaps in our knowledge about gannets is how high they fly. It’s a great research question to try and answer as not only will it help us to better understand how they search for food but it is also very relevant when it comes to their conservation.
Many of you will know something about our need to produce more renewable energy. As a member of the EU the UK Government has pledged to produce 15% of its energy from renewable sources, much of which is set to come from offshore wind farms. One of the biggest questions when it comes to birds and wind farms is how likely is it that they will collide with the rotating turbines? To answer this to the best of our ability we need to know the heights at which birds fly and until now heights used to estimate likelihood of collision have just come from visual observations. As I mentioned in my first post, visual observations have some large drawbacks, but now we can use technology to help us out.
As well as fitting gannets with GPS, this year we have also been putting small pressure loggers on the birds. These devices can record air pressure at a rate of one reading every second which can then be used to calculate altitude. By combining altitude readings with the GPS locations we will be able to analyse foraging trips in three-dimensions and provide important information about how high gannets are flying in areas proposed for windfarm development.
Here you can see the first bird we caught this year having its GPS and pressure logger fitted. Both are taped to the central tail feathers using extremely sticky tape. You can see the GPS has been completely covered in order to ensure the bird doesn’t puncture the waterproof plastic.
-
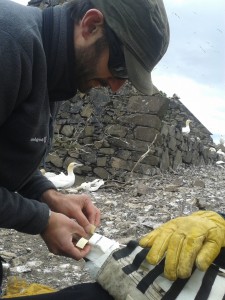
- James Grecian attaching a GPS logger
-
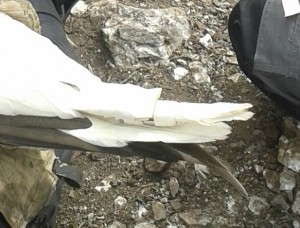
- GPS logger attached to the top of the tail with the pressure logger below
The loggers don’t stay on for long. After about 10 days we re-catch each bird and remove them both. It’s then back to the office, breath held, to find out whether a) we remembered to turn them on, b) we programmed them correctly, c) they recorded what looks to be sensible data!
I am very relieved and excited to say that our efforts have been very successful. You can see below an example of what our first glimpse of the data looks like when we initially download it from the devices (click on an image for a better look).
-
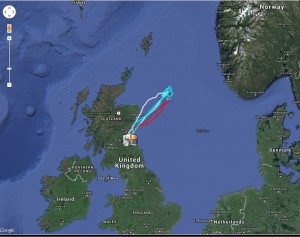
- Foraging tracks: this gannet made three trips shown in red, white and blue
-
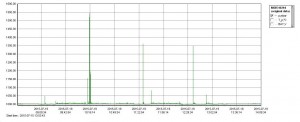
- Pressure/altitude data for part of a foraging trip
My summer of data collection on Bass Rock has sadly come to an end for this year but I’ll continue to post about my experiences of working on the largest gannet colony in the world. For now though I guess it’s time to get comfy at my desk and start to work out what it all means!